一、议员投票
这个数据在近几年的图模型文章中常能见到,并且已有很多深入的讨论——包括图结构随时间变化、多图联合估计等情况。本文只涉及单个图结构的估计,此外笔者对政治不了解,因此文中摘录wiki的相关评论。
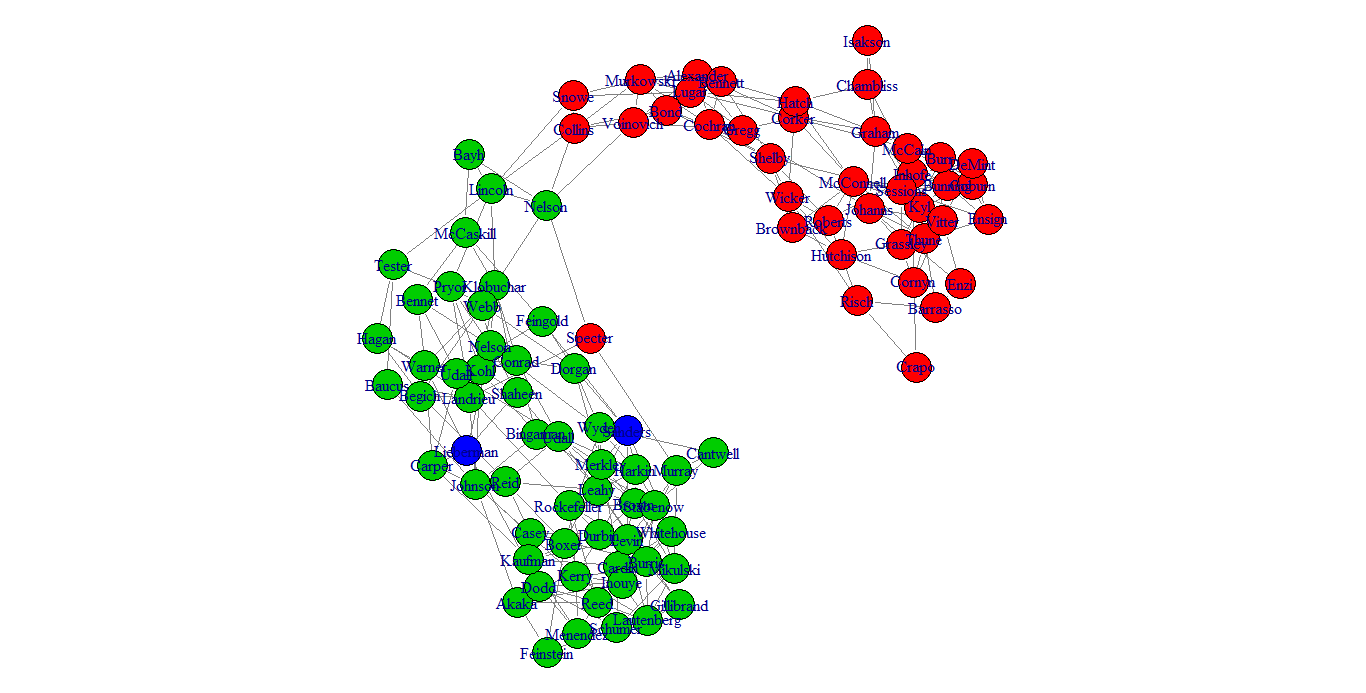
从 http://www.senate.gov 可以看到senators每次投票的结果。那么,你关心的议员在每次投票中起到怎样的作用?有怎样的政治立场?本文数据选取美国第111届议会(2009年、2010年)roll-call vote数据,涉及110位参议员696个议案的投票结果(点击此处下载数据)。利用图模型,我们可以对议员投票行为作图。下图中,每个点代表一个议员,每条边表示两个议员的投票行为“很相似”——他们常常同时投赞成票或反对票。
图中,两派阵营的状态很明显。绿色的是Democrat,红色的是Republican,蓝色的是Independent。一般认为,民主党在政治上偏左,主张社会自由与进步;而共和党偏右,“reflects American Conservatism”。可以从图中获得很多信息,下面我们对此图做一点深究。

首先,红绿交界处的Lincoln、Nelson、Collins等人是否代表了某种“中间力量”?以下从维基摘录的一段话(http://en.wikipedia.org/wiki/Bill_Nelson)或许回答这个问题。
Nelson’s votes have tended to be more liberal than conservative. He has received high ratings from left-of-center groups such as Americans for Democratic Action, and low ones from right-of-center groups such as the Eagle Forum and the Club for Growth. According to ratings by the National Journal, Nelson’s votes have been liberal on economic matters, moderate on social issues, and liberal but close to the center on foreign policy.
其次,我们再来看另一个极端。选取图中远离红点的一个绿点(图中左下角)——Cantwell;以及远离绿色区域的红点(图中右下角)——Enzi。同样是摘自wiki的两段话,验证了他们的“极左”和“极右”。
While she (Cantwell) scores high on a progressive chart from ProgressivePunch.org,[25] Cantwell has made several controversial votes during her time in the Senate that have created friction between her and members of the Democratic Party.
Enzi was ranked by National Journal as the sixth-most conservative U.S. Senator in its March 2007 conservative/liberal rankings.[7] Despite his strong support of the War in Iraq, he was one of 14 U.S. Senators to vote against the Iraq War funding bill in May 2007 because he opposes the clauses of the bill which increase domestic spending.
此外,被绿点包围的蓝点Lieberman——“A former member of the Democratic Party, he was the party’s nominee for Vice President in the 2000 election. Currently an independent, he remains closely affiliated with the party.”
除了以上分析,还可以获得很多信息。比如可以分析图中的重要节点、用局部估计的方法了解投票关联是如何随时间变化的,等等。
二、图模型——罚极大似然
如何才能获得这幅“议员投票图”呢?它的理论依据是什么?估计图结构的方法也有很多,这里只介绍罚极大似然的方法。
图结构估计得常用假设是数据来自正态分布——注意上例的数据为二项分布,banerjee(2007)在论文中探讨了二项分布数据的问题,最终所求解的最优化表达式和正态类似;本文中暂且忽略banerjee(2007)中的细节,把投票数据用正态分布处理。正态分布的概率密度函数为
$$f(x)=\frac{1}{(2\pi)^{p/2}|\Sigma|^{1/2}}\exp\Big\{-\frac{1}{2}(X-\mu)^T\Sigma^{-1}(X-\mu)\Big\}$$
假设数据$x_1, x_2, \cdots, x_n$来自正态分布,每个$x_i$(p维向量)记录p位议员的一次投票结果。如果用协方差矩阵描述议员投票的相关关系,那么它的极大似然估计为,
$$S=\frac{1}{n}\sum_{i=1}^N(x_i-\bar{x})(x_i-\bar{x})^T$$
协方差矩阵的逆$\Omega=\Sigma^{-1}=\big(\omega_{ij}\big)_{p\times p}$在图模型中被称为Concentration Matrix或者Precision Matrix。该矩阵与偏相关系数有如下关系:
$$\rho_{ij|\{i,j\}}=-\frac{\omega_{ij}}{\sqrt{\omega_{ii}\omega_{jj}}}$$
由此可以看出,$\Omega$矩阵中的零元素代表了对应议员投票行为的条件独立关系。
为了在高维问题中更精确地估计$\Omega$矩阵,可以采用罚极大似然估计。首先回顾对数似然函数的表达式
\begin{split} \sum_{i=1}^n\log & f(x_i)=\frac{np}{2}\log(2\pi)-\frac{n}{2}\log|\Sigma| -\frac{1}{2}\sum_{i=1}^n(x_i-\bar{x})^T\Sigma^{-1}(x_i-\bar{x})\\ &=\frac{np}{2}\log(2\pi)-\frac{n}{2}\log|\Sigma| -\frac{1}{2}tr\Big(\sum_{i=1}^n(x_i-\bar{x})(x_i-\bar{x})^T\Sigma^{-1}\Big)\\ &\propto p\log(2\pi)-\log|\Sigma|-tr\big(S\Sigma^{-1}\big) \end{split}
此外,由于$\Omega=\Sigma^{-1}$,令上式最大等价于求解下式的最小值
$$tr(S\Omega)-\log|\Omega|$$
在$\Omega$矩阵非零元素稀疏的假定下,通过加罚,我们可以得到以下的最优化问题(解空间为正定矩阵):
\begin{equation} \min_{\Omega\succ 0}\Big\{tr(S\Omega)-\log|\Omega|+\lambda\sum_{i\neq j}|\omega_{ij}|\Big\} \label{obj:main} \end{equation}
针对此最优化问题,Yuan and Lin(2007)通过maxdet最优化算法求解,banerjee(2007)则借用内点搜索方法(interior point method),此外Friedman(2007)则将它转化为Lasso 的表达形式再通过shooting 算法求解。还有一类算法是从贝叶斯角度考虑,Bayesian Graphical Lasso,思想很像 Bayesian Lasso.
求解(1)式,得到$\Omega$矩阵,它的非零元素便对应“投票图”中的一条边。
三、数据与代码
R数据下载——数据中包含三个矩阵(数据来自http://www.senate.gov)。
- idList矩阵为参议员信息。每行对应一个参议员。5列分别对应:议员id,last name, first name, state, party(Democrat, Republican or Independent)
- bilInfo为投票议案信息(bil info)。每行对应一项议案信息,4列分别为:议案编号、投票时间、议案描述、投票结果。
- voteMatrix矩阵为投票信息,每行对应bilInfo的议案,每列对于idList的一个议员。若voteMatrix的第i行第j列数值为1,表示议员j对议案i投了赞成票;-1表示反对票;NA表示未投票。
代码很简单,只有以下几行:
library(spaceExt)
library(igraph)
load("senate.RData")
#移除投票缺失较多的议员
sel=which(!(colSums(is.na(voteMatrix))>100))
partyD=as.numeric(idList[sel,5]=="D")
partyI=as.numeric(idList[sel,5]=="ID" | idList[sel,5]=="I")
#用spaceExt做计算
res=glasso.miss(voteMatrix[,sel],20,rho=0.1,penalize.diagonal=FALSE)
#计算偏相关系数矩阵
p=-res\$wi
d=1/sqrt(diag(res\$wi))
p=diag(d)%*%p%*%diag(d)
diag(p)=0
#igraph包生成图模型、作图
g=graph.adjacency((p>(0.055)),mode="undirected",diag=F)
V(g)\$color=(partyD+2+partyI*2)
V(g)\$label=idList[sel,3]
par(mar=c(0,0,0,0))
plot(g,layout=layout.fruchterman.reingold, edge.color=grey(0.5),vertex.size=10)
相关文章补充:
- Yuan, M., and Lin, Y. (2007) Model selection and estimation in the Gaussian graphical model. Biometrika , 94, 1, pp. 19–35
- Friedman, J. H., Hastie T, Tibshirani R. “Sparse inverse covariance estimation with the graphical lasso.” Biostat (2008) 9 (3): 432-441.
- Banerjee, O., Ghaoui, L. E. and d’Aspremont, A. (2007), Model selection through sparse maximum likelihood Estimation, J. Machine Learning Research 101.
- Wang, H. The Bayesian Graphical Lasso
- Mladen Kolar, Le Song, Amr Ahmed, Eric P. Xing. Estimating time-varying networks. Annals of Applied Stat.arXiv:0812.5087v2

发表/查看评论